The dashboard says your AI visibility score fell 8 points this week. Someone forwards it with a question mark. Before anyone rewrites the pricing page, it's worth asking a question most AI visibility reports never answer: how much would that number move if nothing had changed at all?
We worked it out for the metrics teams use most, using the run-to-run data from our own September 2026 checks. The short version is that some AI visibility metrics are worth watching closely, some need far more data than most teams collect, and one kind can't be fixed by more data at all.
Two ways a metric misleads
Every metric in this space fails in one of two ways.
The first is statistical noise. AI answers change from run to run, so any rate built from a sample of answers wobbles. In our rerun of five help desk questions, three times each, 17 of 65 brand-question pairs flipped at least once between runs. This kind of noise shrinks as you add runs and questions.
The second is structural. The number depends on a choice someone made, like a formula, a weighting or which questions are in the pool. Running the check ten more times doesn't help, because the uncertainty isn't in the sample.
We give each metric what we call a trust grade based on both. Here's the whole scorecard, assuming a check of 20 questions run three times each, which is roughly what a careful team can manage by hand.
| Metric | Trust grade | Change worth believing at 20 questions x 3 runs | What it can't tell you |
|---|---|---|---|
| Mention rate | Good, with patience | About 15 to 18 points between two checks | Whether anyone clicked or bought |
| Citation rate | Good, with patience | About 13 to 18 points | Whether the cited page led anywhere |
| Share of voice | Fine for trends | Gaps under about 2 points are ties | Why a competitor moved |
| Top pick or position | Poor | Not reliable at 3 to 5 runs | Whether being first matters more than being named |
| Blended visibility score | Poor, and more runs won't fix it | Depends on a formula you often can't see | Which ingredient moved |
| Search Console, Bing and GA4 counts | Good, at volume | Depends on monthly volume (see below) | What the answer said about you |
AI search traffic grew 835% this year. Is your content ready?
RankControl generates 26 content formats optimized for ChatGPT, Claude, and Perplexity. Published on your domain, matched to your brand.

Mention rate and citation rate: good, if you respect the noise
These are the backbone metrics: the share of answers that name you and the share that cite your site. Both are simple counts, and both get more reliable with more runs.
The question is how big a change has to be before it's real. For two checks of 60 answers each, a mention rate near 50% can differ by up to about 18 percentage points by chance alone, at the usual 95% confidence level. For a citation rate nearer 16%, the band is about 13 points. That's consistent with what we found in our guide to AI visibility scores, where even 100 answers per check left room for a 14-point swing by chance.
If anything, those figures are generous. The three runs of one question aren't fully independent of each other, so the true noise is a bit larger.
How you count matters too. If you collapse each question's three runs into one yes-or-no before calculating, you're back to 20 data points instead of 60, and the band widens to about 31 points. Count every run.
The practical rule: don't react to a week-to-week move under 15 points. Compare quarters, and look for the same direction across three or more checks before calling it a trend.
Share of voice: fine for trends, weak for close races
Share of voice divides your mentions by all tracked brands' mentions. It's useful over months and misleading in a close race.
In the worked example from our AI visibility dashboard guide, Freshdesk had a 14.3% share of voice across 25 answers and Help Scout had 13.0%. The total pool was roughly 154 brand mentions, so one extra mention for Help Scout would have moved it about 0.6 points. The whole 1.3-point gap between them comes down to about two answers.
A single volatile question can flip two answers on its own. So treat gaps under about 2 points as ties, and don't put a claim like "we passed Freshdesk" in a board deck until it holds for a full quarter.
Top pick: don't report it at three runs
Which brand an answer names first feels like the most meaningful metric, and it's the least reliable.
When we asked OpenAI's model with web search for the best webinar platform for SaaS product demos five times on the same day, it picked Demio twice and Livestorm three times. It's tempting to call that a narrow Livestorm lead. But if the true preference were an exact coin flip, a 2-3 or 3-2 split would happen 62.5% of the time. Five runs can't tell a real lead from no lead at all.
Position is a coarser signal than presence, since each answer produces one winner instead of a yes or no for every brand. Getting a trustworthy read takes dozens of runs per question. Our guide to LLM visibility monitoring explains how to log the top pick without treating it as a headline number.
Blended scores and vendor indexes: problems more runs can't fix
A single AI visibility score folds mentions, citations and sometimes position into one number. The trouble is the recipe. When we scored the same 25 answers three ways, the leading brand changed depending on the formula alone.
Vendors rarely publish their recipes in full. Semrush's knowledge base describes its score like this:
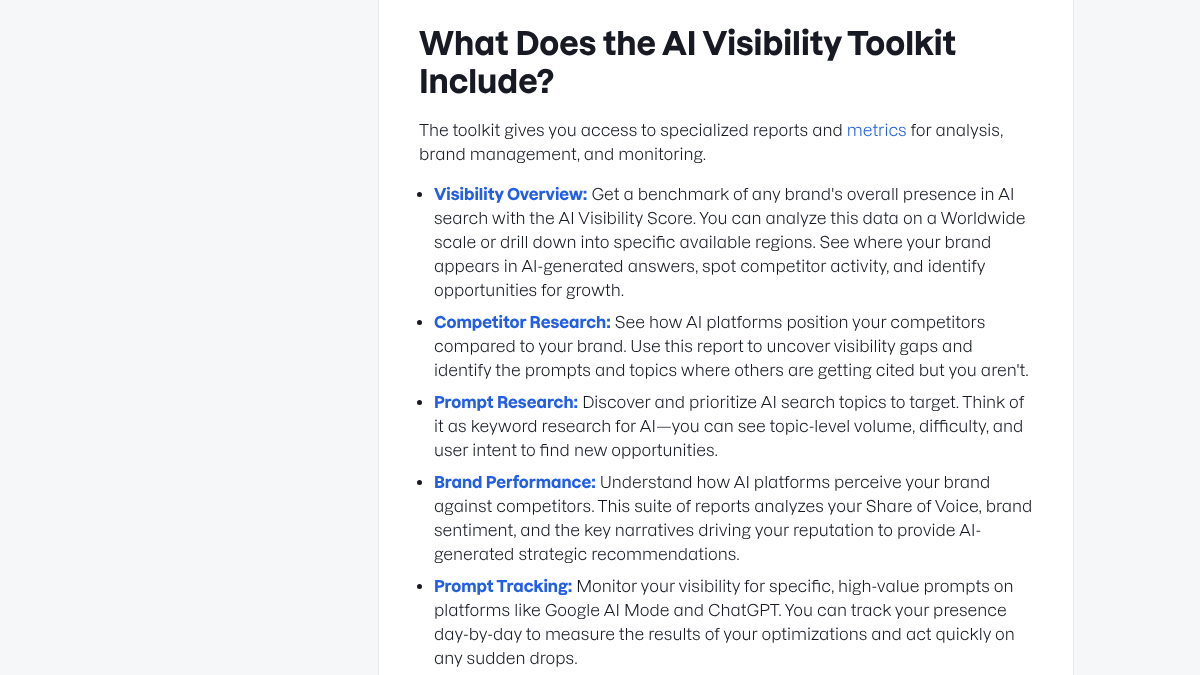
Its AI Visibility Score "reflects how often your brand is mentioned in AI-generated answers compared to the median number of mentions for your top industry competitors," updated daily. That's a relative score, and its full weighting isn't published.
Ahrefs' Brand Radar shows a different structural issue. Its AI Visibility Index is built from prompts derived from Ahrefs' keyword database, and "question sets are re-tested monthly on a 90-day reporting window." Its custom prompts, the questions you write yourself, can run daily. Ahrefs itself notes the index "works best for established brands or topics with meaningful search demand." So two share-of-voice numbers from the same vendor can disagree because they measure different question pools, not because anything changed.
Before trusting any score, find out which questions it uses, which engines, how often it refreshes and how it weights the parts. If the answer isn't available, read the underlying mention and citation rates instead. Our post on why we track seven engines instead of one score makes the longer case.

Built by the team that got cited in 48 hours.
Content generation, backlink building, AI visibility tracking, and Google rankings. One platform, zero guesswork.
Platform counts: real numbers, small samples
Google Search Console's generative AI report, Bing Webmaster Tools' AI Performance report and GA4's AI Assistant channel don't sample questions at all. They count real events, which removes one kind of noise and adds another: small numbers.
A simple rule covers it. At N events a month, one extra event moves your share by roughly 100 divided by N points. At 20 AI-referred signups a month, one more signup moves the share by 5 points. At 100, it moves it by 1. Below about 50 events a month, read these reports quarterly, not monthly.
Each also has a blind spot. Search Console shows AI impressions with no clicks and no total to divide by. Bing counts citations but not whether you were recommended. GA4's AI Assistant channel excludes Google's own AI Overviews and AI Mode, which it files under organic search. Our post on AI traffic that trickles but converts covers how to read that channel.
A reporting setup that survives the math
Put it together and a defensible AI visibility report looks like this:
- A fixed set of at least 20 buyer questions, run at least three times each on every engine you report, counted per run.
- Mention rate and citation rate, reported separately and per engine, compared quarter over quarter.
- Share of voice as a trend line, with gaps under 2 points called ties.
- Top pick logged but not headlined unless you run each question many times.
- No blended score unless you know its formula.
- Platform counts read quarterly until they pass about 50 events a month.
Practitioners reach the same conclusion. In an r/SaaS thread about measuring AI search visibility, the original poster worried tools were "just making up numbers," and the top reply said a single screenshot is basically useless data: rankings don't exist in AI answers, only stability, so you have to run the same prompts many times and average them.
How to measure AI Search Visibility?
I've been thinking about this a lot from a marketer's pov. Because most people are now using chatgpt, claude, perplexity etc instead of traditional search so if your brand doesn't get mentioned, you basically don't exist to them. But how do...
Doing it yourself or handing it off
By hand, a 20-question, three-run check across two engines is about 120 answers a week, or roughly two hours of running and logging. The quarterly analysis adds an afternoon.
Or RankControl can collect the data for you. Our AI visibility tracking checks up to 50 buyer questions every week across seven AI engines, marks each answer as mentioned, cited or both, and records every source it used, per engine. Our analytics log AI-referred visits and AI crawler visits for each page. For a quick first look, run the free AI visibility check.
See your first AI citation report in under 5 minutes.
No setup calls. No onboarding meetings. Connect your domain and see where AI mentions your brand right now.