
Every few weeks someone asks us, politely, why the dashboard doesn't just give them one number. A single AI visibility score, zero to a hundred, up and to the right. And every few weeks we give the same slightly awkward answer: because the number would be lying to you, and we'd know it was lying while we sold it to you. This post is the long version of that answer, the evidence that made the call and the real costs of making it, including the parts of the critique we agree with.
The Meeting Where We Almost Built It
Be honest about the temptation first: a blended score is a better product in every way except the one that matters. It demos beautifully. It fits in the first slide of a board deck. It prices well. It gives a CMO a KPI to own, a number that moves, a reason to renew. We sketched it early, weights per engine, smoothing for the drift, and the mock looked fantastic, which is exactly what worried us. Because we'd already seen what the underlying data looked like, and the score's smoothness was manufactured by averaging away everything the data was trying to say.
We've All Seen This Movie Before
Marketing has run this exact experiment already, and the results are in every SEO veteran's scar tissue. Third-party composite metrics, domain scores and authority numbers, started as rough research shorthands and hardened into targets: teams reported them to boards, agencies sold campaigns against them, and an entire industry optimized a number no search engine ever used, sometimes at the expense of the rankings the number was supposed to proxy. The lesson wasn't that composite metrics are evil; it's the old rule that a measure becomes a target and stops measuring. An AI visibility score is that story restarting with fresher paint, except worse, because at least the old composites summarized one surface. This one would summarize six surfaces that actively disagree, which means the gaming, when it comes, won't even be gaming anything in particular. We'd rather not hand the industry its next vanity target with our logo on it.
The Evidence That Killed the Score
The engines disagree with each other, and they disagree structurally rather than marginally. Backlinko's citation analysis found 91% of cited URLs appear in only a single LLM's answers. Perplexity and ChatGPT share only about 11% of their cited domains for equivalent queries, per a 680-million-citation audit. Large-scale citation datasets show each engine running its own source diet, community-heavy here, index-driven there. And Profound's tracking puts citation-position drift at 40-60% month over month, per platform, before you even try comparing across them.
Don't take a vendor's word for it, though, ours included. When Aleyda Solis worked through nine months of Semrush's own AI Visibility Index source data, comparing ChatGPT against Google's AI Mode across five industries, her top-line finding was the same one: the platforms lean on meaningfully different sources.
👀 I went through 9 months of @semrush AI Visibility Index source data comparing ChatGPT and Google AI Mode across Business Services, Consumer Electronics, Software, Fashion and Finance: The top outcome isn't just that the two platforms rely on different source ecosystems, but https://t.co/nbUp40Ilus
 Aleyda Solis 🕊️@aleydaMay 15, 2026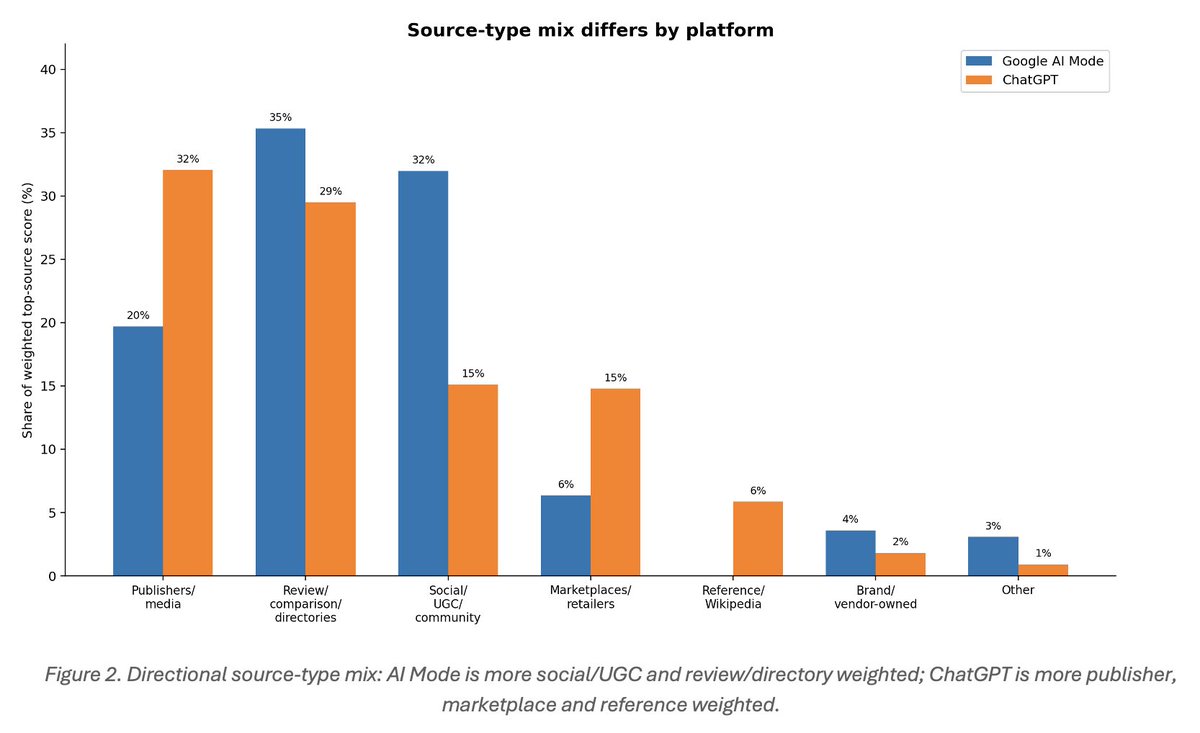
Sit with what that means for arithmetic. Averaging six surfaces that disagree at the source level produces a fiction with good posture. The mean of six unlike things describes none of them, and the more the engines diverge, which is the actual trend, the less the blend means anything at all.
26 content formats. Published on your domain. Matched to your brand.
Guides, comparisons, listicles, case studies, and more. RankControl generates content that gets cited by ChatGPT, Perplexity, Claude, Gemini, Grok, and Google AI Mode.

What the Blend Hides, Concretely
So what does averaging actually destroy? Three patterns from our own tracking made this vivid enough to end the debate internally, described qualitatively because they're our customers' data. The net-zero quarter: a brand loses ground steadily on one engine while gaining on another, and the blend reads flat for months, no alarm, no investigation, while a competitor consolidates an entire surface unchallenged. The invisible win: a team ships a structural retrofit, one engine responds within weeks, and the blend moves too little to notice because five engines' noise swamps one engine's signal, so the team concludes the work didn't pay and stops doing the thing that was working. And the drift masquerade: month-to-month churn that's normal per engine aggregates into blended wobble that looks like trend, prompting strategy conversations about what is, statistically, weather.
Each pattern has the same shape: the score actively converts action-relevant differences into reassurance or panic, both unearned. A metric that can't tell you what to do next is decoration.
The Steelman, Because the Critics Have a Point
Okay, being fully honest for a paragraph: the skeptics of this whole category make arguments we agree with more than our marketing might suggest. The sharpest version is about burden of proof, and it deserves reading in the critic's own words:
I keep being asked to prove that prompt tracking doesn't work. But that reverses the burden of proof. The companies selling AI visibility platforms are making the positive claim: that a configurable portfolio of selected, inferred or generated prompts can measure a brand’s
 David McSweeney@top5seoJul 28, 2026
The argument: companies selling AI visibility platforms make the positive claim, that a configured panel of prompts measures something real, and the burden sits on us rather than on the doubters. Correct, and here's our attempt to carry it. A fixed prompt panel is a sample rather than a census, so we treat it as an instrument for trend rather than totality: same prompts on the same cadence, so when a line moves, the world moved. We log cited URLs separately from name-drops, because being quoted and being mentioned are different events with different value. And the falsifiable claim we stake the product on is the one you can test in your own data: the lines move when you ship relevant work and hold when you don't. If your tracker's lines don't behave that way, per engine, you should churn, from us or anyone.
What we won't defend is the version of this category the critics are actually attacking: proprietary blended indexes with hidden weights, and dashboards that move for reasons no one can explain. That product deserves the skepticism. It's also the product we declined to build, which is rather the point of this essay.
When a Single Number Is Actually Fine
Fairness requires the flip side, because blended indexes do have legitimate jobs. As market-level research instruments they're genuinely useful, the Semrush index data Aleyda mined is exactly that, a way to study category-wide patterns across thousands of brands, and her analysis is better because that dataset exists. As one-off audit snapshots they're fine too: a prospect-facing "here's roughly where you stand" number does no harm when nobody operates on it. The sin isn't computing an average; it's running a brand's weekly decisions on one. Instruments should match their use: telescopes for the market, microscopes for your own funnel, and the category's recurring mistake is selling telescopes to people who need to see their own hands.
What We Built Instead
The unglamorous version: 50 buyer queries, checked weekly, across all six engines, with per-engine citation history, share of voice against named competitors, the actual answer text, and the cited URLs, kept so every data point decomposes back to evidence. Weekly because 40-60% monthly drift makes monthly checks an under-sample. Fixed panel because a moving target measures your fiddling. Six columns because six surfaces disagree, and the disagreement is the information: which engine dropped you, and which fix moved which surface, the questions a one-number product structurally cannot answer.
The exec view we do provide is a trend line per engine plus share of voice, which survives the board deck fine. It turns out leadership needs one page more than one number, and those are different requirements the score conflated.

Your competitors are getting cited by AI. You're not.
Every day without citation tracking is a day your competitors pull ahead in ChatGPT, Perplexity, and Claude.
The Real Problem Was Interface Design, Silently Reframed as Math
Here's the part of this story I rarely see admitted anywhere: the demand for one score is mostly a demand for legibility, and legibility is a design problem that got outsourced to arithmetic because averaging is cheaper than designing. When a dashboard shows six raw tables and a customer's eyes glaze, the lazy fix is to collapse the data; the honest fix is to make six truths readable at a glance. So that's where the work went for us: trend lines instead of tables, per-engine columns, competitors overlaid so "rising where" answers itself, and a weekly digest that reads like a briefing rather than an export. None of that is glamorous engineering, and all of it is the actual answer to "just give me one number," because what people mean by that sentence is almost always "don't make me work to know if something needs me." Fair request. The score answers it by hiding things; the design answers it by surfacing them. When a customer tells us they read their Monday digest in ninety seconds and knew nothing needed them, that's the one-number experience delivered without the one-number lie, and it took us embarrassingly long to understand that this was the assignment all along.
What Six Columns Feel Like on a Monday
The lived version, qualitatively, since the argument can sound abstract. The weekly checks land and you read six lines the way you'd read six gauges. Most weeks, most lines hold, and the reading takes two minutes. The weeks that matter look like this: one engine's line dips while five hold, and because the drop is isolated, the investigation is already scoped, something about that engine's diet or that page's freshness, and twice out of three times the culprit is findable within the hour, a staled date, a blocked fetch, a competitor's new comparison page. Meanwhile a column like Grok sits flat for a customer whose buyers don't live on X, and the honest response is to ignore it guilt-free, which a blended score would never permit, since the flat column would just quietly drag the average and demand explanation at review time. The emotional difference is the real product: six columns make visibility feel like instrumentation, one score makes it feel like a horoscope, and teams act on instrumentation.
What This Decision Costs Us
The honest ledger, because product essays that only list upsides are ads. Six columns take thirty seconds to explain, where a big animated number takes none. We lose the vanity-metric buyers, the teams that want a score to report rather than a system to act on, and they're a real market segment someone else happily serves. Some buyers will pick a tool because one big number looks prettier than six columns, and we'd rather lose that sale than hide which engine moved. One number would be easier to sell, and far less useful the first week something breaks. We accepted all of that on a simple bet: the teams that want to act on AI visibility outlast the teams that want to admire it, and tools get judged eventually by whether the work they prompted actually worked. We launched in 2026, so we won't claim a trend line of our own yet; the weekly checks will show whether the bet holds.
How to Apply This Even If You Never Pay Us
The principle travels without the product, so here's the DIY version and the vendor test in one. Build a fixed panel of fifteen buyer prompts, run it weekly per engine by hand, and log two columns separately: named, and cited with the URL. Within a month you'll have per-engine trend lines and you'll never again trust a blended anything. And when you evaluate any tracker, including ours, ask the three questions this essay earns: can every number decompose back to actual answers and cited URLs, is the panel fixed and the cadence stated, and can the vendor show you a case where their data caught a single-engine drop that a blend would have averaged away? Any tool that answers all three is doing honest work, whatever its dashboard looks like. Any tool that answers none of them is selling you a mood ring with an API.
Six columns instead of one score, then, plus a design bill we're still paying down, and every slightly awkward, thirty-seconds-longer demo since. Still the right call by every measure we trust, and the engines keep diverging in ways that make it a little righter every quarter, which is the most reassuring form of being wrong about what sells.
200+ SaaS teams already track their AI citations.
They know exactly when ChatGPT mentions their brand, and when it stops. Do you?